ggpatchy adds a pattern aesthetic to ggplot2 geoms.
Patterns are rendered via native grid graphics — no ImageMagick or
external raster dependencies are required.
Bar and column charts
geom_col_pattern() and geom_bar_pattern()
are drop-in replacements for geom_col() and
geom_bar(). Map pattern to a discrete variable
with scale_pattern_manual() or
scale_pattern_discrete().
df <- data.frame(
  category = c("A", "B", "C", "D"),
  value    = c(3.2, 5.1, 4.0, 2.7)
)

ggplot(df, aes(category, value, fill = category, pattern = category)) +
  geom_col_pattern() +
  scale_pattern_manual(values = c(
    A = "hatch", B = "crosshatch", C = "dots", D = "vertical"
  )) +
  scale_fill_brewer(palette = "Pastel1") +
  theme_minimal() +
  labs(title = "geom_col_pattern()")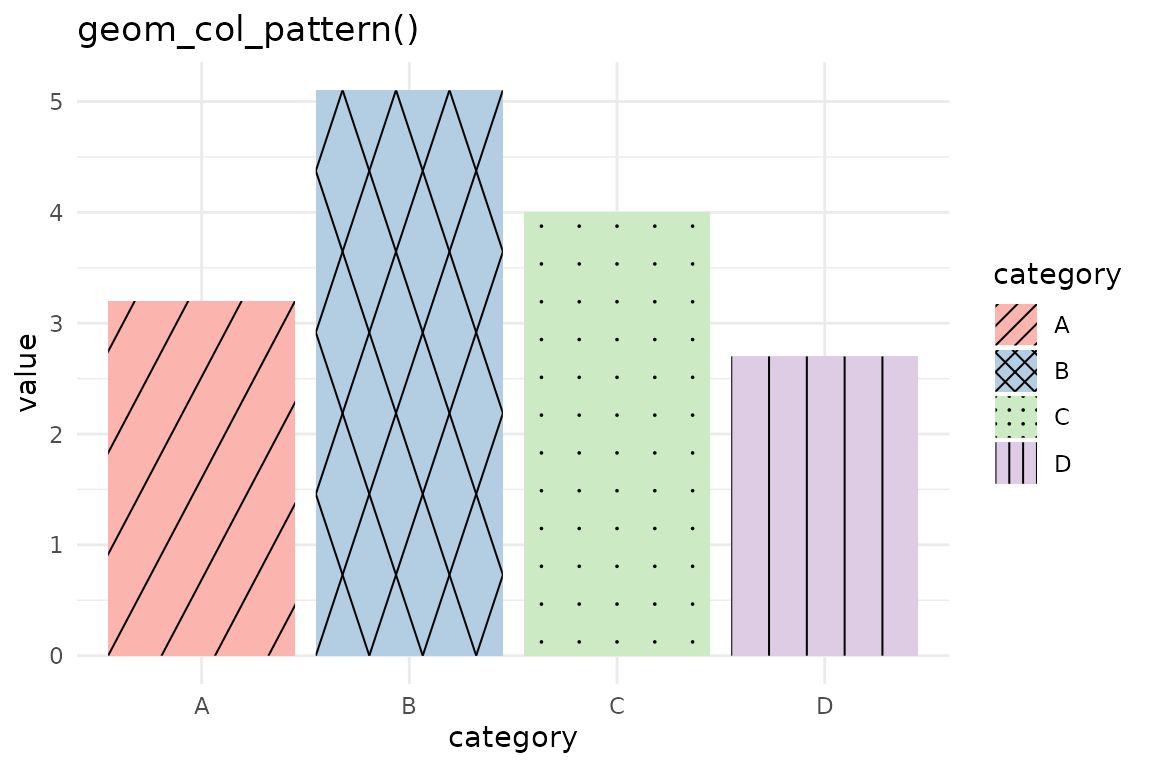
geom_bar_pattern() uses stat = "count":
ggplot(mpg, aes(class, fill = class, pattern = class)) +
  geom_bar_pattern() +
  scale_pattern_discrete() +
  scale_fill_brewer(palette = "Set3") +
  theme_minimal() +
  theme(axis.text.x = element_text(angle = 30, hjust = 1)) +
  labs(title = "geom_bar_pattern() with scale_pattern_discrete()")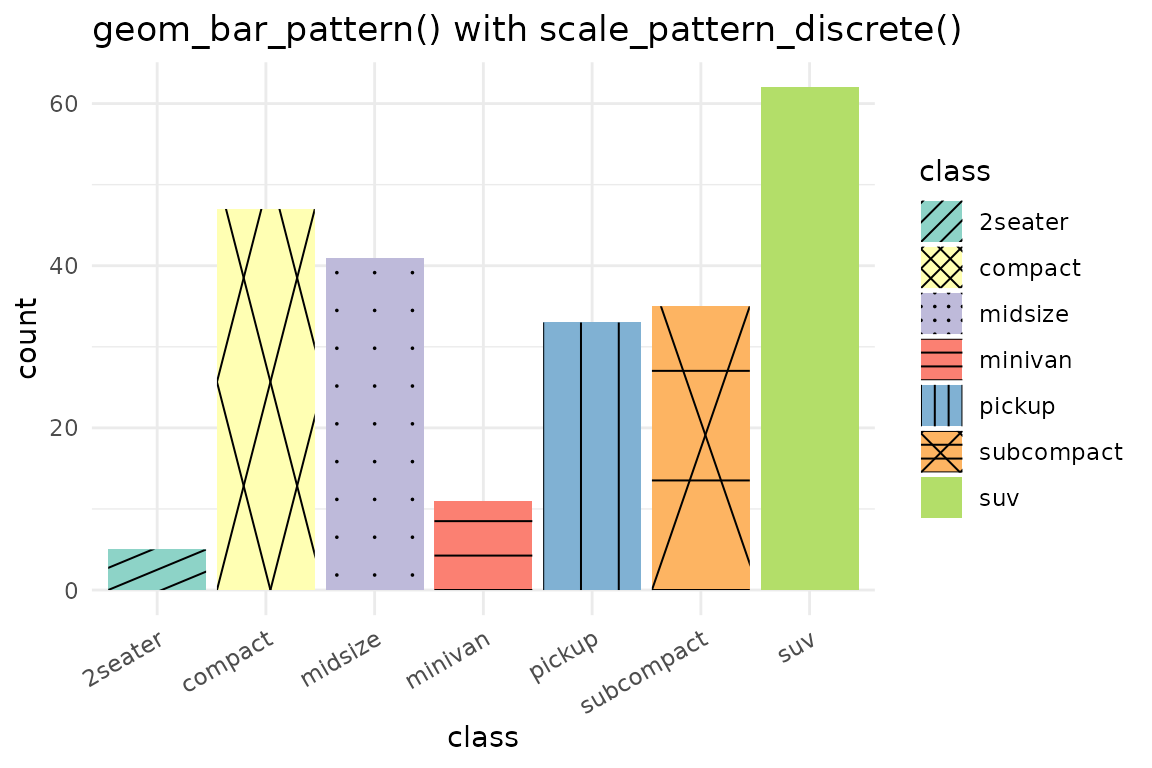
Polygons
geom_polygon_pattern() clips patterns to the exact
polygon boundary, not just the bounding box. This means concave shapes
like crescents or L-shapes are handled correctly.
theta <- seq(0, 2 * pi, length.out = 7)[-7]
hex <- data.frame(x = cos(theta), y = sin(theta))

ggplot(hex, aes(x, y)) +
  geom_polygon_pattern(
    pattern        = "hatch",
    fill           = "lightyellow",
    pattern_colour = "goldenrod",
    pattern_angle  = 30,
    pattern_spacing = 4
  ) +
  coord_fixed() +
  theme_void() +
  labs(title = "geom_polygon_pattern() on a hexagon")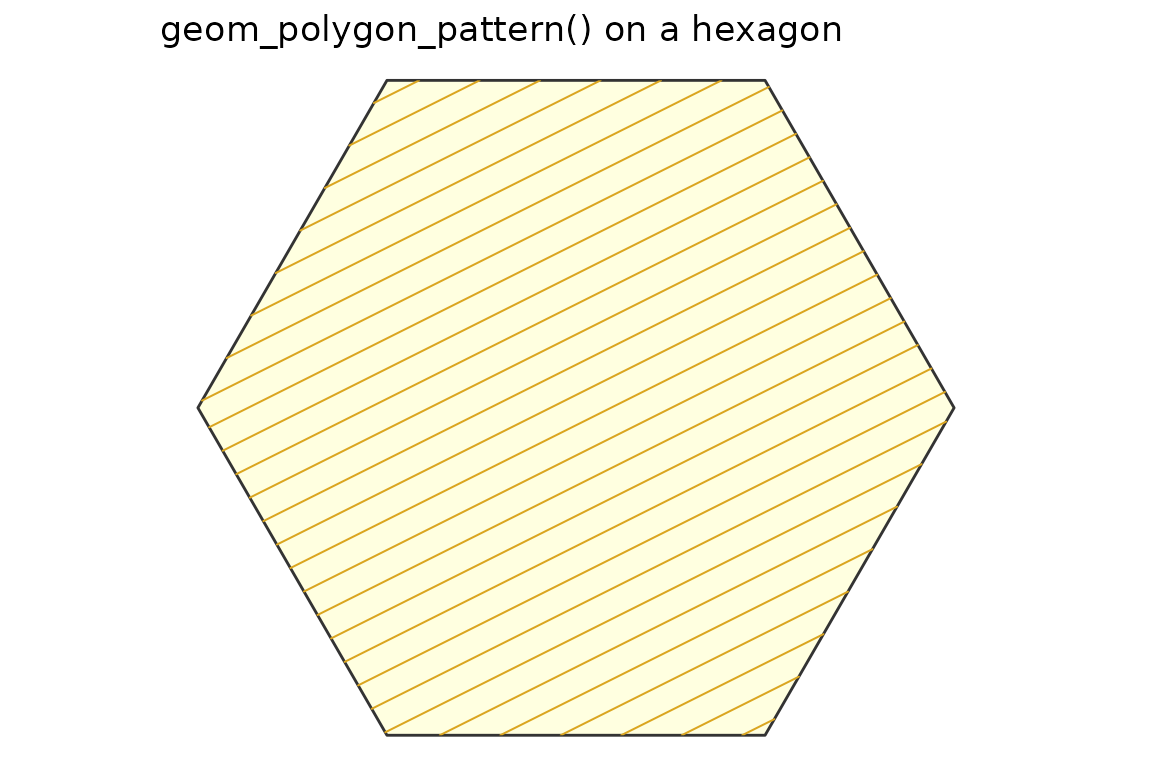
Ribbon charts
geom_ribbon_pattern() adds patterns to confidence bands
or any region defined by ymin and ymax.
x  <- seq(0, 2 * pi, length.out = 80)
df <- data.frame(x = x, ymin = sin(x) - 0.3, ymax = sin(x) + 0.3)

ggplot(df, aes(x, ymin = ymin, ymax = ymax)) +
  geom_ribbon_pattern(
    pattern        = "hatch",
    fill           = "lightblue",
    pattern_colour = "steelblue"
  ) +
  theme_minimal() +
  labs(title = "geom_ribbon_pattern() — confidence band")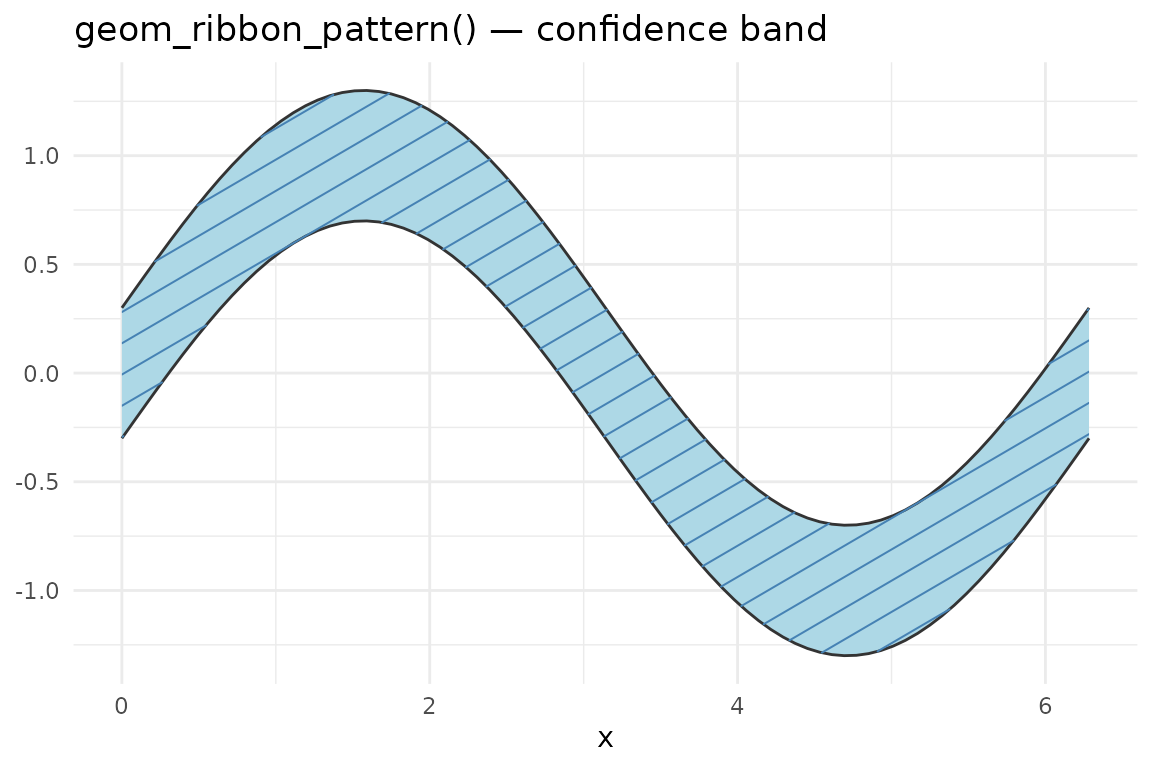
Multiple groups with different patterns:
df2 <- data.frame(
  x       = c(x, x),
  ymin    = c(sin(x) - 0.2, cos(x) + 0.5),
  ymax    = c(sin(x) + 0.2, cos(x) + 1.0),
  group   = rep(c("sin", "cos"), each = length(x)),
  pattern = rep(c("hatch", "crosshatch"), each = length(x)),
  fill    = rep(c("lightblue", "lightyellow"), each = length(x))
)

ggplot(df2, aes(x, ymin = ymin, ymax = ymax,
                group = group, fill = fill, pattern = pattern)) +
  geom_ribbon_pattern(alpha = 0.8) +
  scale_pattern_identity(guide = "legend") +
  scale_fill_identity() +
  theme_minimal() +
  labs(title = "geom_ribbon_pattern() — two groups")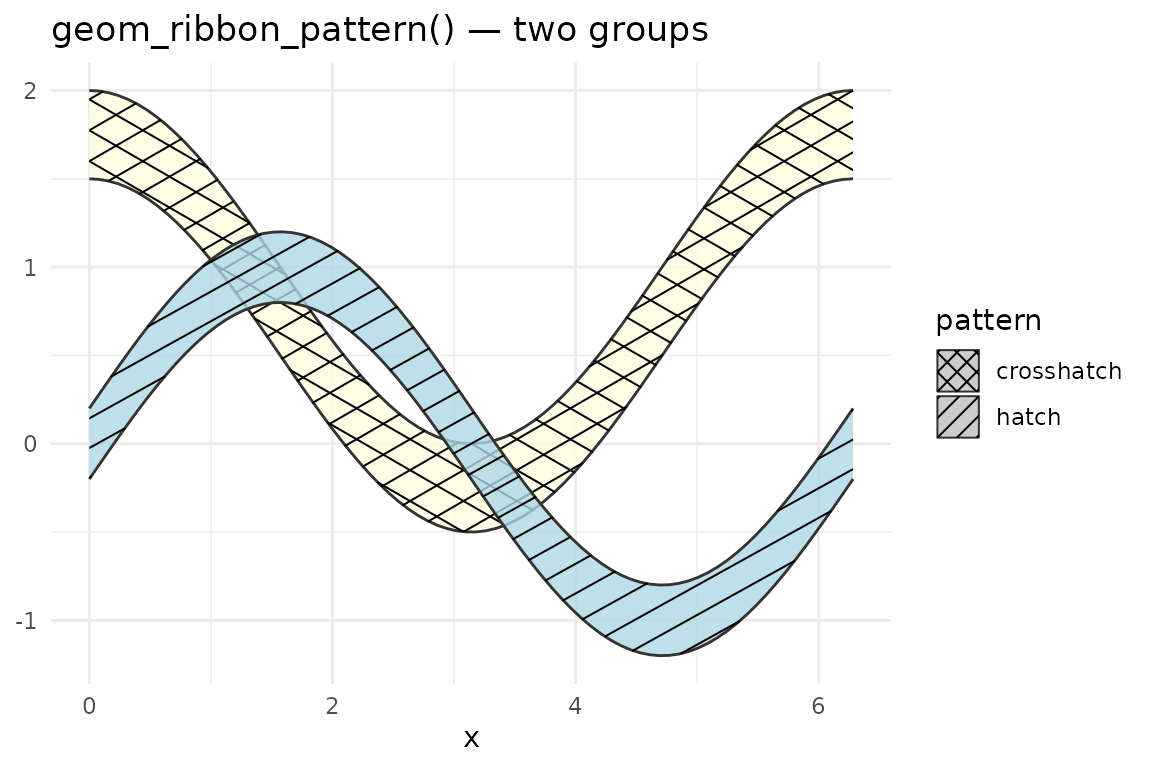
Area charts
geom_area_pattern() mirrors geom_area(): it
sets ymin = 0 automatically and defaults to
position = "stack".
df3 <- data.frame(
  x       = rep(1:8, 2),
  y       = c(1, 3, 2, 4, 3, 2, 4, 3,
              2, 1, 3, 2, 1, 3, 2, 1),
  group   = rep(c("Group A", "Group B"), each = 8),
  pattern = rep(c("hatch", "crosshatch"), each = 8)
)

ggplot(df3, aes(x, y, fill = group, pattern = pattern)) +
  geom_area_pattern(position = "stack", alpha = 0.85) +
  scale_pattern_identity(guide = "legend") +
  scale_fill_brewer(palette = "Pastel1") +
  theme_minimal() +
  labs(title = "geom_area_pattern() — stacked")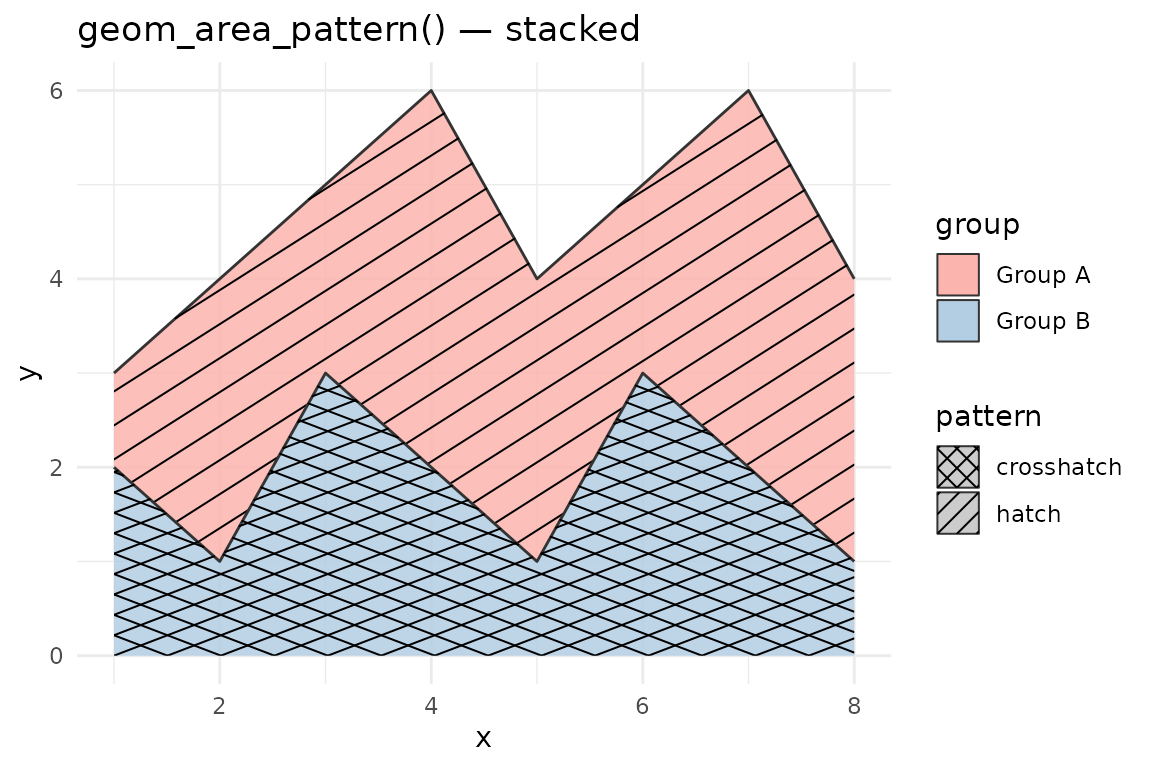
Violin charts
geom_violin_pattern() adds patterns to violin plots. Use
it as a drop-in replacement for geom_violin().
ggplot(mpg, aes(class, hwy, fill = class, pattern = class)) +
  geom_violin_pattern(pattern_colour = "grey30") +
  scale_pattern_discrete() +
  scale_fill_brewer(palette = "Pastel1") +
  theme_minimal() +
  theme(axis.text.x = element_text(angle = 30, hjust = 1)) +
  labs(title = "geom_violin_pattern()")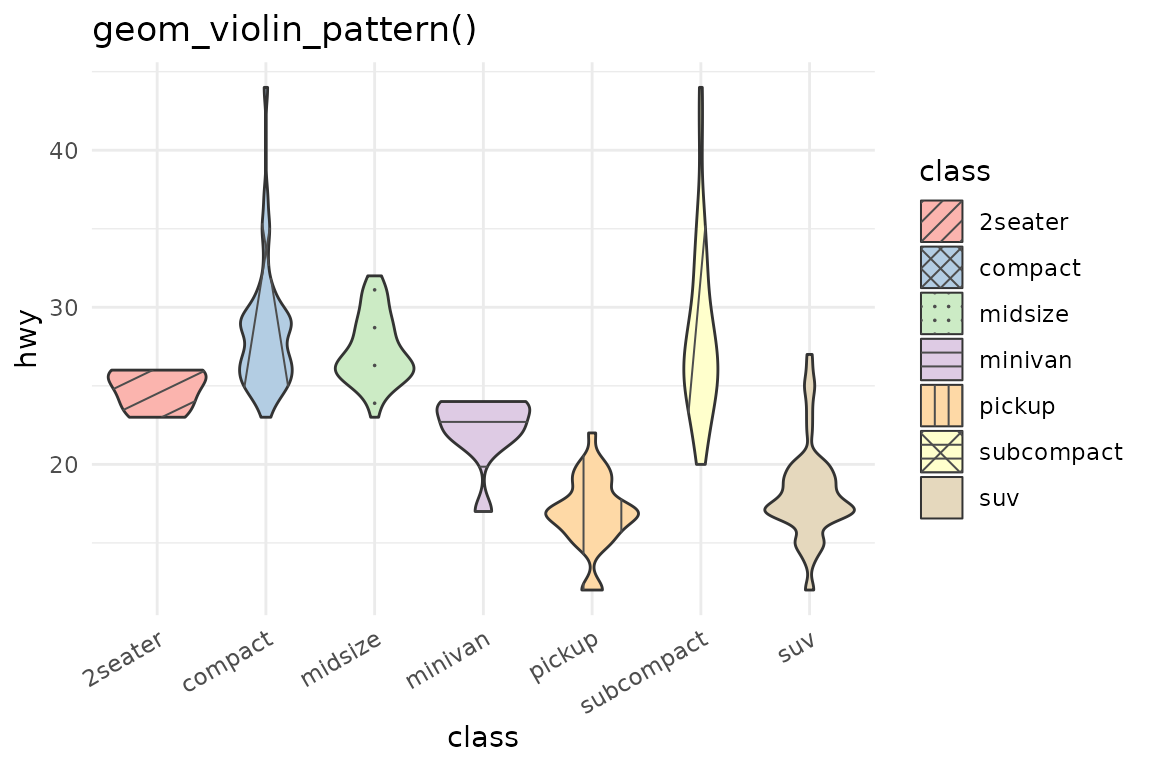
Density plots
geom_density_pattern() extends
geom_density() for pattern fills on smooth density
estimates.
ggplot(mpg, aes(hwy, fill = drv, pattern = drv)) +
  geom_density_pattern(alpha = 0.7, pattern_colour = "grey20") +
  scale_pattern_manual(values = c("4" = "hatch", "f" = "crosshatch", "r" = "dots")) +
  scale_fill_brewer(palette = "Pastel2") +
  theme_minimal() +
  labs(title = "geom_density_pattern()")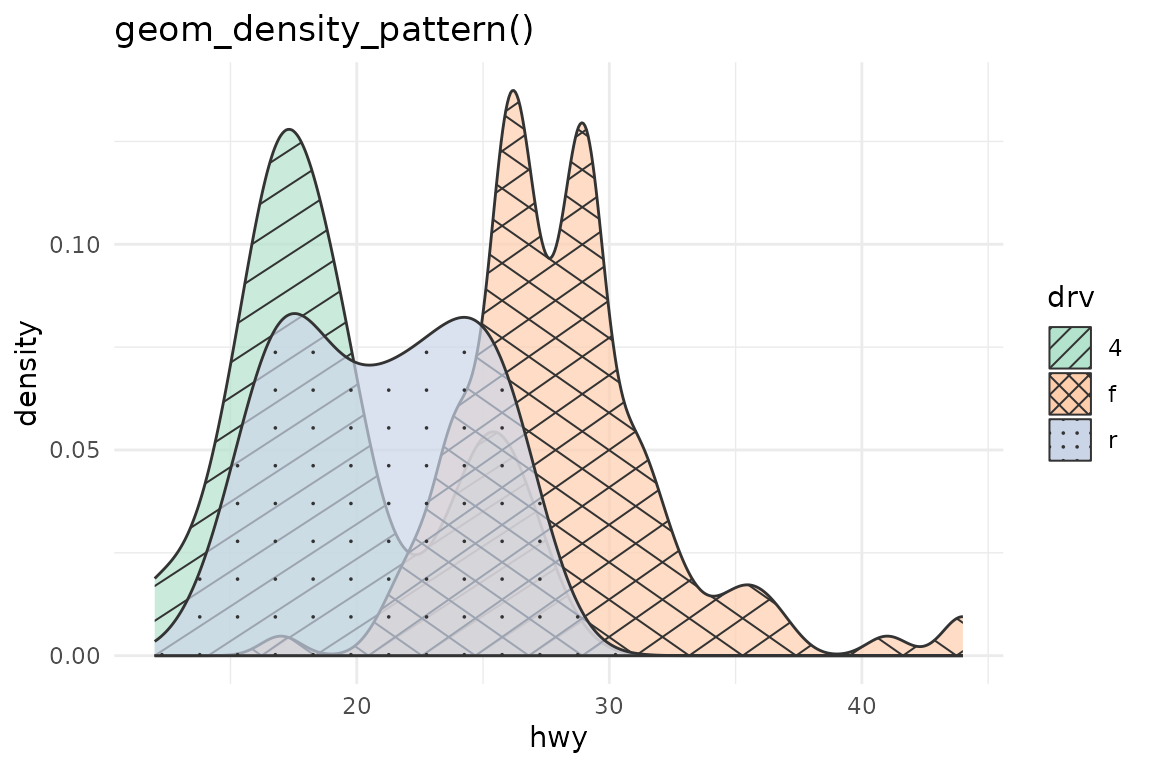
Rectangles and tiles
geom_rect_pattern() and geom_tile_pattern()
add pattern overlays to rectangle geoms.
geom_tile_pattern() is convenient for heatmap-style layouts
where cells are specified by centre coordinates.
blocks <- data.frame(
  xmin    = c(0, 1, 2, 0, 1, 2),
  xmax    = c(1, 2, 3, 1, 2, 3),
  ymin    = c(0, 0, 0, 1, 1, 1),
  ymax    = c(1, 1, 1, 2, 2, 2),
  pattern = c("hatch", "crosshatch", "dots", "vertical", "horizontal", "weave")
)

ggplot(blocks, aes(xmin = xmin, xmax = xmax, ymin = ymin, ymax = ymax,
                   fill = pattern, pattern = pattern)) +
  geom_rect_pattern(pattern_colour = "grey30") +
  scale_pattern_identity() +
  scale_fill_brewer(palette = "Pastel1") +
  coord_fixed() +
  theme_void() +
  labs(title = "geom_rect_pattern() — all six line/dot patterns")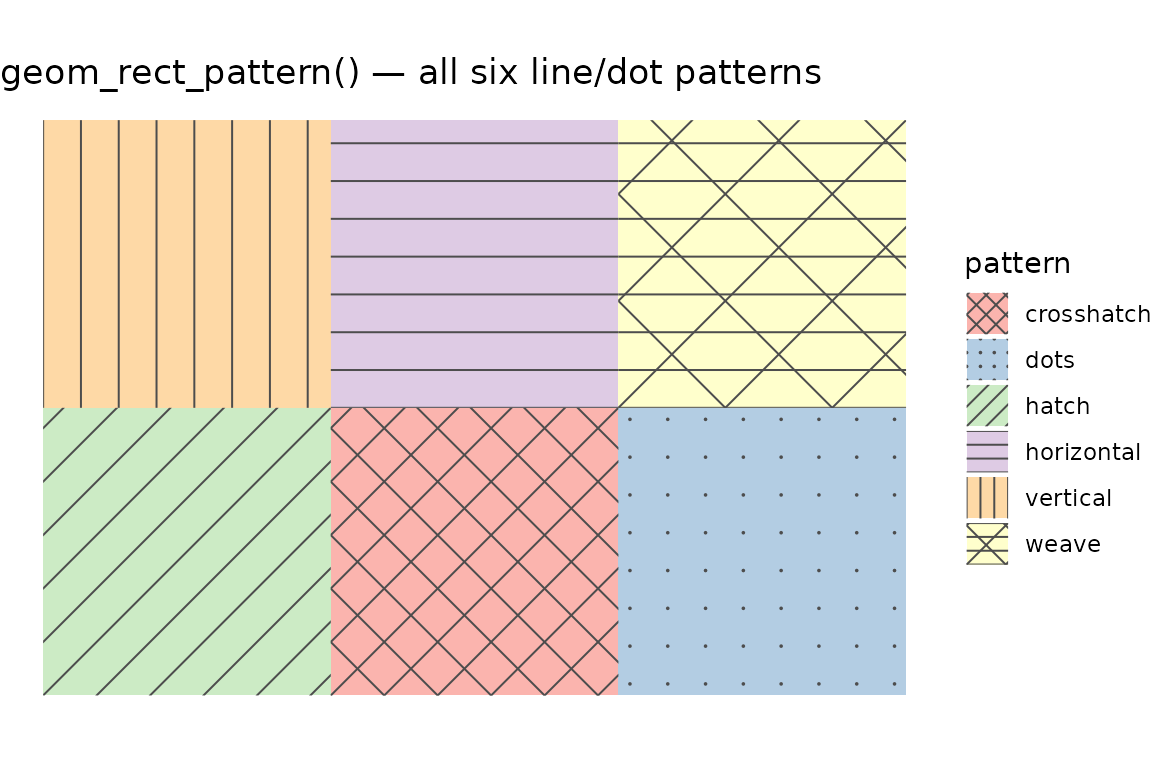
Choropleth maps
geom_sf_pattern() works with sf geometry columns. It
uses pattern to add a second encoding channel alongside fill colour,
which is useful for accessibility (grayscale printing, colour-vision
deficiency). See the Mapping with Patterns vignette for
full examples with the NC counties and US states datasets.
Pattern reference
Built-in patterns:
| Name | Description | Respects pattern_angle? |
|---|---|---|
none |
No pattern (fill only) | — |
hatch |
Diagonal lines | Yes |
crosshatch |
Crossed diagonal lines | Yes |
horizontal |
Horizontal lines | No (fixed) |
vertical |
Vertical lines | No (fixed) |
dots |
Regular dot grid | No (fixed) |
weave |
Woven over/under line texture | No (fixed) |
pattern_spacing is in millimetres:
pattern_spacing = 5 places pattern elements 5 mm apart on
every shape at every size. Visual density is uniform across all shapes
in the same plot. Custom patterns can be registered with
register_pattern().
Known limitations
stat = "identity" with
geom_violin_pattern() requires a violinwidth
column. The default stat ("ydensity") computes
violinwidth automatically from your raw data. If you pass
stat = "identity" with pre-summarised density data, your
data frame must include a violinwidth column (values in [0,
1] giving the normalised half-width at each y level). If
the column is absent, geom_violin_pattern() emits an
informative message and skips that group rather than crashing.
orientation = "y" (horizontal) is not supported
for pattern overlays. geom_violin_pattern(),
geom_ribbon_pattern(), and geom_area_pattern()
all skip the pattern when orientation = "y" or
flipped_aes = TRUE. The base shape still renders correctly.
Use coord_flip() on a vertical geom as a workaround.
Non-Cartesian coordinates: Patterns are drawn in
screen (npc) space after coord$transform(). Under
coord_polar or coord_sf the pattern lines
remain straight in screen pixels rather than following the coordinate
curvature.