These are drop-in replacements for ggplot2::geom_col() and
ggplot2::geom_bar() that add support for a pattern aesthetic.
Map pattern to a discrete variable using scale_pattern_manual() or
scale_pattern_discrete().
Usage
geom_col_pattern(
  mapping = NULL,
  data = NULL,
  position = "stack",
  ...,
  width = NULL,
  na.rm = FALSE,
  show.legend = NA,
  inherit.aes = TRUE
)

geom_bar_pattern(
  mapping = NULL,
  data = NULL,
  position = "stack",
  ...,
  width = NULL,
  na.rm = FALSE,
  show.legend = NA,
  inherit.aes = TRUE
)
Arguments
- mapping
Aesthetic mappings created by
ggplot2::aes().- data
Data frame.
- position
Position adjustment. Default
"stack".- ...
Other arguments passed to the layer.
- width
Bar width, as a proportion of the bin width.
- na.rm
If
FALSE(default), missing values are removed with a warning.- show.legend
Logical. Should this layer be included in the legend?
- inherit.aes
If
FALSE, overrides the default aesthetics.
Pattern aesthetics
In addition to all aesthetics accepted by ggplot2::geom_col(), these
geoms accept:
patternCharacter name of the pattern. One of
"none","hatch","crosshatch","horizontal","vertical","dots","weave", or a custom pattern registered withregister_pattern(). Each base pattern (except"none") also has_denseand_sparsevariants (e.g."hatch_dense","dots_sparse") for pre-set tighter or looser spacing.pattern_colourColour of pattern lines/dots. Default
"black".pattern_linewidthLine width for line-based patterns. Default
1.pattern_spacingSpacing between pattern elements in millimetres. Default
5. Smaller values produce denser patterns; larger values produce sparser patterns. Named density variants (e.g."hatch_dense") bake in a pre-set spacing multiplier but still respect explicitpattern_spacingvalues.pattern_angleAngle in degrees for hatch patterns. Default
45.pattern_sizeDot radius in millimetres for the
"dots"pattern. Default0.5.
Examples
library(ggplot2)
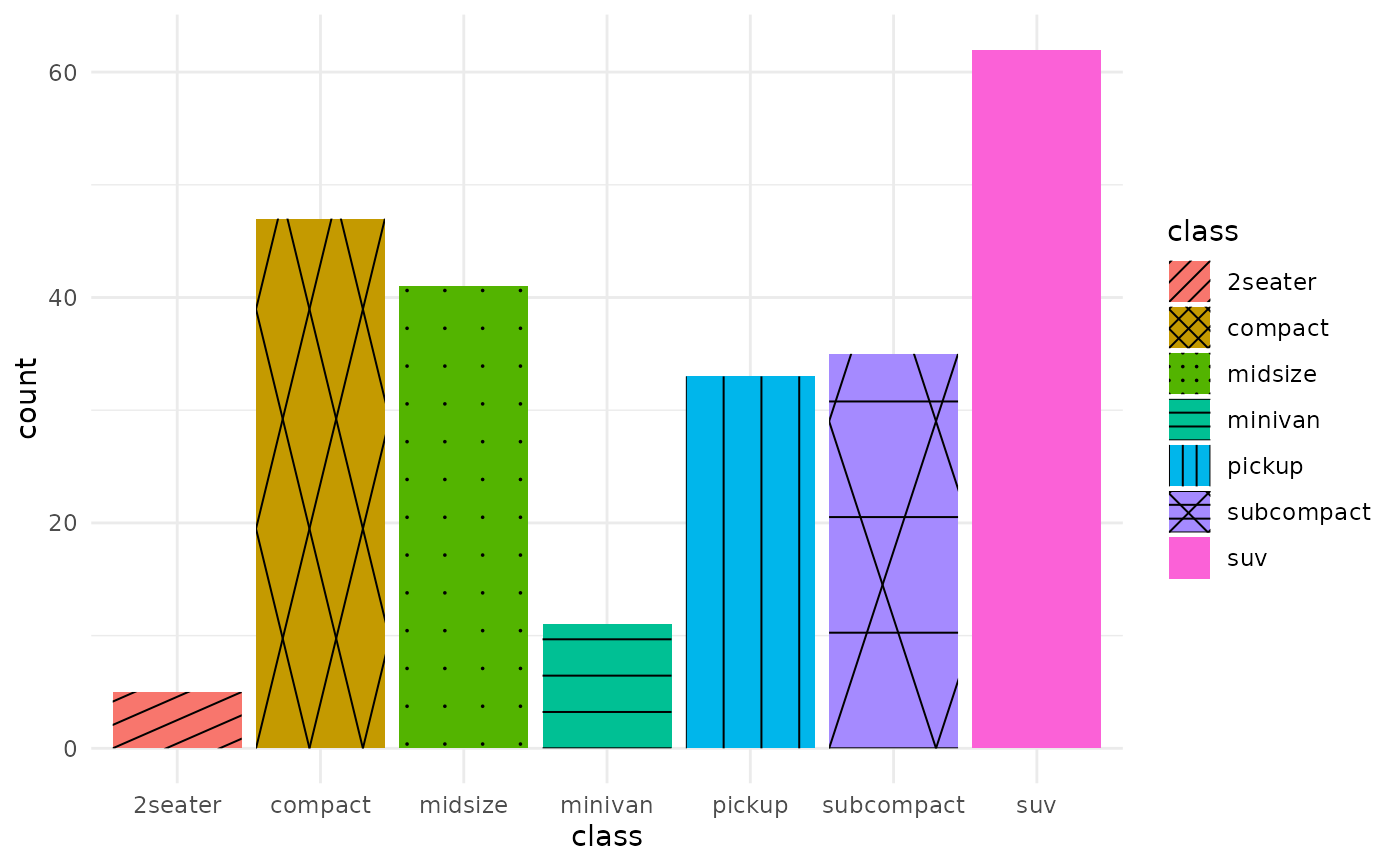
# geom_bar_pattern uses stat="count" automatically
ggplot(mpg, aes(class, fill = class, pattern = class)) +
geom_bar_pattern() +
scale_pattern_discrete() +
theme_minimal()
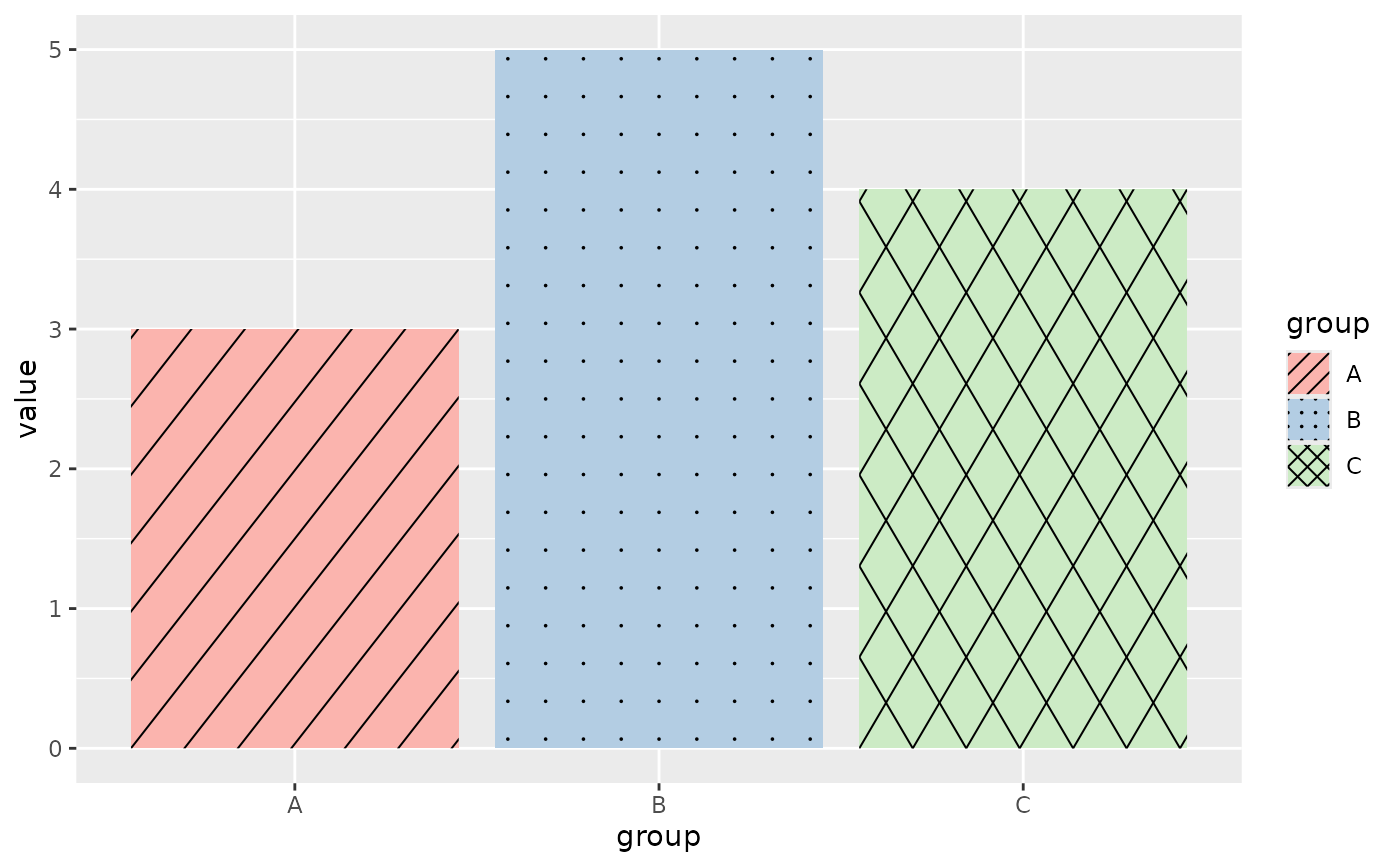
 # geom_col_pattern needs x and y (pre-summarised data)
df <- data.frame(
group = c("A", "B", "C"),
value = c(3, 5, 4)
)
ggplot(df, aes(group, value, fill = group, pattern = group)) +
geom_col_pattern() +
scale_pattern_manual(values = c(A = "hatch", B = "dots", C = "crosshatch")) +
scale_fill_brewer(palette = "Pastel1")
# geom_col_pattern needs x and y (pre-summarised data)
df <- data.frame(
group = c("A", "B", "C"),
value = c(3, 5, 4)
)
ggplot(df, aes(group, value, fill = group, pattern = group)) +
geom_col_pattern() +
scale_pattern_manual(values = c(A = "hatch", B = "dots", C = "crosshatch")) +
scale_fill_brewer(palette = "Pastel1")